|
After selecting a drug model you may modify any of these model parameters:
| • | Target peak, peak predict time, and target trough. |
| • | Length of infusion |
New analysis
Enter the dosage regimen that is being evaluated and the measured serum level data. Important: in order to simplify data entry the following assumtions are made. If any one of the following conditions are not met, then the serum level analysis will likely be inaccurate:
| • | Dose has been infused at a constant rate over the specified infusion time. |
| • | Dose has been administered at the specified dose and interval. |
| • | Drug level draw times are accurately recorded. |
Previous analysis
|
If there are previous levels on record for this patient, the Retrieve button will be enabled. Click it to display the previous dose and serum level data.
Analysis method
Multiple analysis methods are available. Choose the method which best fits your serum level data.
|
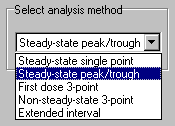
Method (click for picture) |
Data required |
Analysis used |
A single timed level after a steady-state dose. |
Bayesian |
|
|
|
|
A trough drawn before and a peak drawn after a steady-state dose. |
Sawchuk/Zaske or Bayesian |
|
|
|
|
2 or 3 serum levels drawn after a steady-state dose. |
Sawchuk/Zaske or Bayesian |
|
|
|
|
2 or 3 serum levels drawn after an initial loading dose. Please note: this method assumes a pre-dose level of ZERO. In other words, there must be NO DRUG on board when the loading dose is given. |
Linear regression |
|
|
|
|
A trough before the dose, then a peak and trough after the dose. |
Sawchuck/Zaske |
|
|
|
|
For aminoglycosides only: a single timed level after a steady-state dose. |
"Hartford nomogram" |
Ideal dose calculation
|
After entering the dose and serum level data, click the Calculate button.
The program performs a few simple checks of your data entry, if no results are displayed then you have entered inappropriate data. If your data entry is within limits, the program will calculate and display the Kel, Vd, and the ideal dosing regimen for the patient and model selected.
You then enter a practical dose and interval. The program will calculate and display an estimated steady-state peak and trough level for your selected regimen.
To view the dose in mg/kg, hover the mouse pointer over the dose input box.
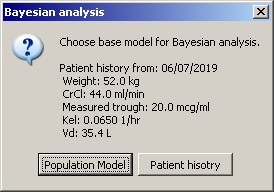
Bayesian base model selection
If a Bayesian methodology is selected and previous history of serum level analysis is found, the base model for Bayesian analysis may be selected.
| • | Choose either the population model or the historical model. |
| • | The date and details of the most recent analysis is displayed. Use this information to determine whether the patient history is applicable to the current situation. |
|
Please Note:
After a dose and interval are entered, the Print and View Graph functions are enabled.
It is important that you Print a dosing consult because it is at this point that the program saves the dose and levels data.
If you wish to have a serum level graph printed on your dosing consult, click the View Graph icon ![]() then click Save Graph.
then click Save Graph.