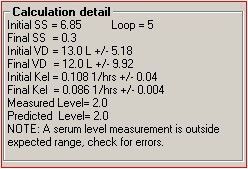
The "Calculation Detail" section displays several parameters which are used to evaluate the accuracy, reliability, and expected performance of the Bayesian derived model.
| 1. | The first data pair, labeled SS, displays the residual sum of squares. This is an indicator of how well the Bayesian derived model fits the data. A Final SS that is close to zero indicates a good fit. |
| 2. | To the right of SS, labeled "Loop", is the number of loops through the Bayesian routine that were required to minimize the residual sum of squares (SS). A lower number indicates a better fit. |
| 3. | The next data pair compares the Initial and Final distribution volumes. The Initial VD is derived from the population model, with the model's standard variance. While the Final VD is derived from the Bayesian analysis, with the calculated variance. A small variance of the Final VD indicates a better fit. It is also important to compare the raw numbers, Initital VD and Final VD, a small difference indicates a better fit. |
| 4. | The third data pair compares the Initial and Final elimination rates. As with Initial VD, the Initial Kel is derived strictly from the population model. And once again, the variance of the Final Kel, and the difference between Initial and Final Kel are indicators of the degree of fit. |
| 5. | The fourth data pair is a comparison between the measured level and that which is predicted by the derived model (using the Final VD and Final Kel). An exact match of this pairing indicates a model which fits the data. |
| 6. | And finally, the program may display an 'outside of expected range' notice which indicates that the serum level data differs substantially from the population model. |
Using this information, let's compare two example outputs, one a good fit, the other a poor fit.
Good fit: |
|
Poor fit: |
||||||||||||||||||||||||
|
|
|||||||||||||||||||||||||
|
(serum level entry highlighted in red) |
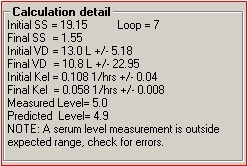
Unfortunately, outputs are rarely so black and white, usually there are mixed signals. If most of these signals are negative, then the Bayesian derived model may not perform well. There may have been a problem with the serum level measurement in the patient. Obvious sources of error should be ruled out, such as: administration errors, lab draw errors, timing errors, etc. If no potential sources of error are found, there is a possibility that the patient may be an outlier. Regardless, these numbers are indicating that you should keep a close eye on this patient.