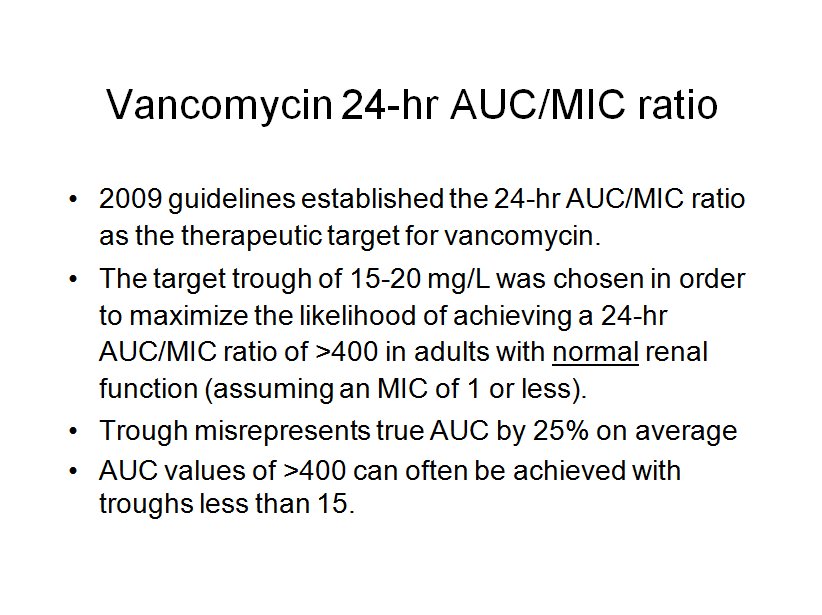
Recent evidence regarding vancomycin pharmacokinetics/pharmacodynamics has initiated a paradigm shift in vancomycin dosing from targeting trough concentrations to area under the concentration-time curve (AUC), specifically the 24-hr-AUC/MIC ratio.
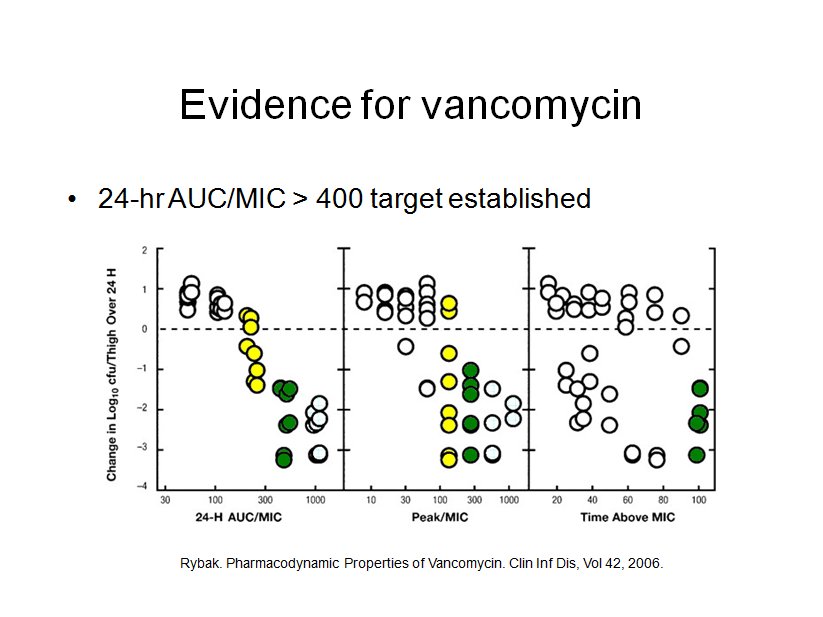
Compelling clinical data suggests that targeting a vancomycin 24-hr-AUC/MIC ratio of at least 400 mg · h/liter will ensure efficacy. The 2009 consensus committee on vancomycin TDM made the assertion that the vancomycin trough level is a good surrogate for the AUC, because in most adult patients a steady-state trough concentration of 15 to 20 mg/liter correlates with a 24-hr-AUC/MIC ratio of at least 400 for an organism with an MIC of 1 mg/liter or less.
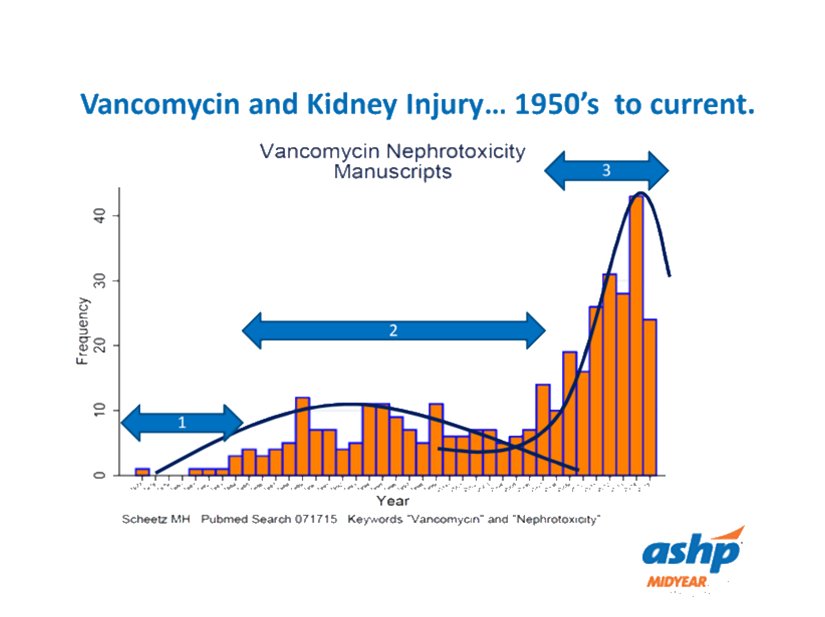
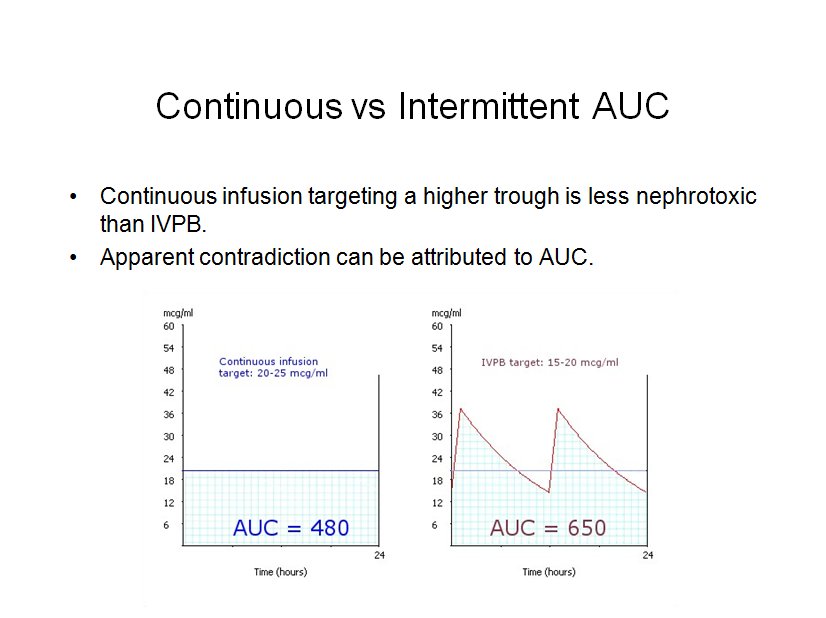
Since the implementation of the vancomycin consensus guidelines, several studies have documented a higher incidence of nephrotoxicity associated with the more aggressive trough goal. In contrast, a large meta-analysis suggested that a continuous infusion targeting a constant vancomycin concentration of 25 mg/liter is less nephrotoxic than standard intermittent dosing. This can be explained if we attribute the risk of vancomycin nephrotoxicity to the AUC, just as we do for efficacy.
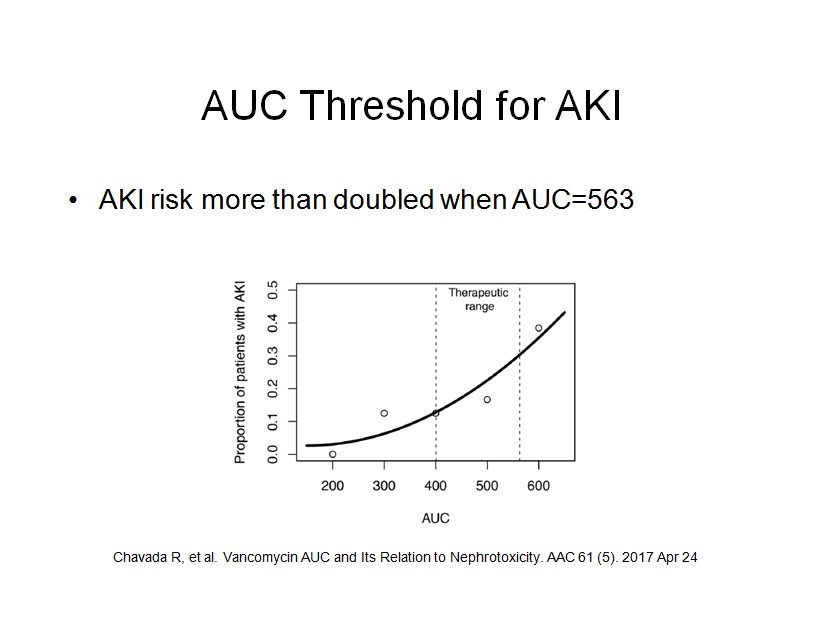
To date the AUC threshold for vancomycin nephrotoxicity has not been clearly defined, 600 to 700 has been suggested. The goal of Chavada et al was to define the upper limit of the vancomycin AUC range. They found that a vancomycin 24hr-AUC of greater than 563 mg · h/liter was associated with significantly increased risk of AKI.
One of the features of APK that I am most proud of is the population analysis tool. Each time you save a consult based on serum level analysis, the pk parameters are saved. This data set is a goldmine of information about your patient population.
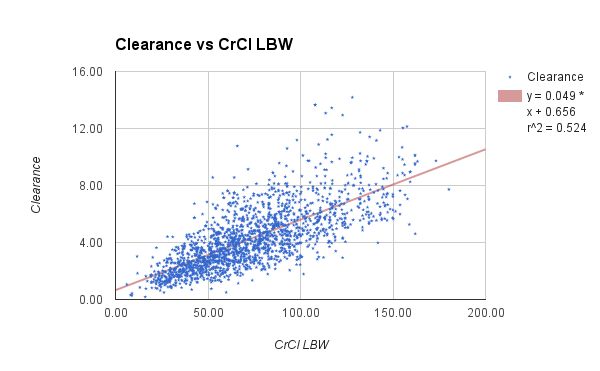
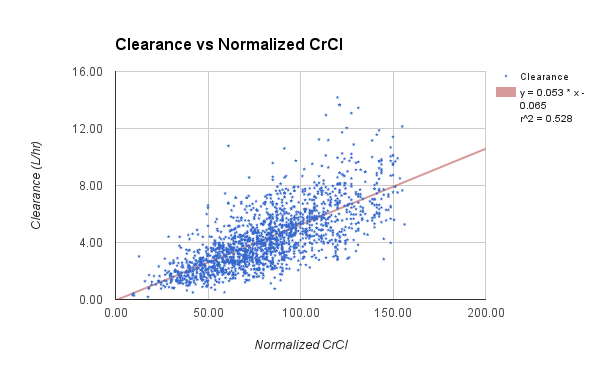
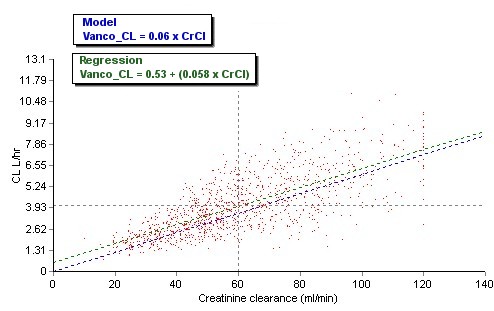
The data set presented below is from 1,671 adult general med-surg patients, with 1,078 in the subgroup of BMI less than 30. The vanocomyin pk model used for Bayesian analysis of this subgroup is similar to that used by Chavada.
Patient demographics
Total=1078, F=486, M=592
| Ave
| Min
| Max
|
|---|
Age (years)
| 61.6
| 19
| 99
|
Weight (kg)
| 68.1
| 35.7
| 114.2
|
SrCr (mg %)
| 0.87
| 0.3
| 4.8
|
CrCl (ml/min)
| 55.7
| 10
| 120
|
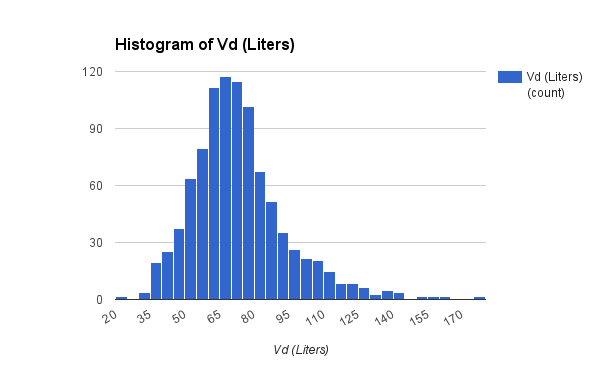
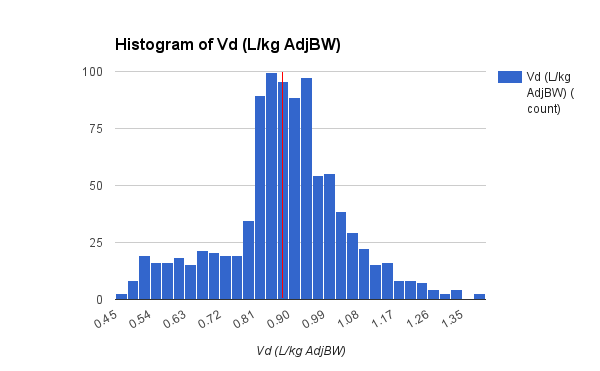
Vd (L/kg)
| 0.72
| 0.62
| 0.83
|
Half-life (hours)
| 9.2
| 3.5
| 46.2
|
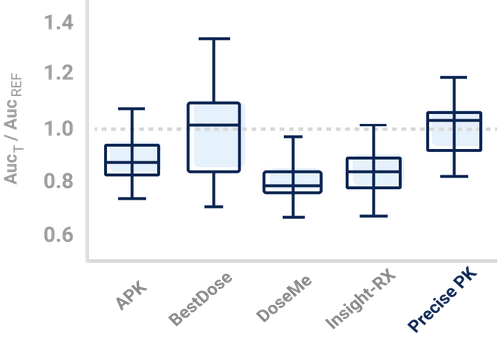
The patient specific pk parameters from this data set were then used to determine a dosing regimen based on either a target trough goal of 15 to 20 or a target AUC goal of 400 to 563. Dosing intervals were based on half-life and converted to a more practical 6, 8, 12, 18, 24 or 48 hours. Doses required to achieve the therapeutic goal were rounded to nearest 250mg whenever possible.
Assuming an MIC of 1 or less, the minimum target AUC was determined to be 400. The upper limit of AUC was set to 563, as determined by Chavada. This target range is displayed within the shaded area in the figures below.
Targeted trough dosing
Doses required in this group ranged from 400 to 2000mg. As we often see in clinical practice, a significant number of regimens (91) did not achieve a trough of 15 within what is considered a safe dose range.
All dosage regimens in the targeted trough group achieved an AUC of at least 400, which confirms the goal of the 2009 guidelines. However, the majority of these doses, 597/1078 (55%), resulted in an AUC above the likely AKI risk threshold.

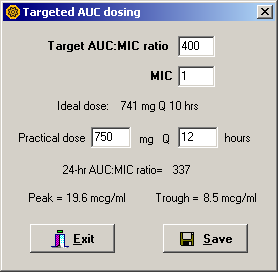
Targeted AUC dosing
Doses required to achieve the target AUC ranged from 400 to 1500mg.
All dosage regimens in the targeted AUC group also achieved an AUC of 400. No doses resulted in an AUC above the AKI risk threshold. This analysis also confirms previously reported studies which found that, in the majority of patients, an AUC of 400 can be achieved with a trough less than 15. In this analysis, 77% of dosing regimens (831/1078) achieved the AUC goal with a trough less than 15.

Although controversy remains regarding whether vancomycin has a direct toxic effect, vancomycin-associated nephrotoxicity has been linked to troughs greater than 15. Targeted AUC dosing of vancomycin would be expected to reduce unnecessarily high exposure and thus reduce nephrotoxicity.
Reference
Chavada R, Ghosh N, Sandaradura I, Maley M, Van H. Establishment of an AUC0–24 threshold for nephrotoxicity is a step towards individualized vancomycin dosing for methicillin-resistant Staphylococcus aureus bacteremia. Antimicrob Agents Chemother 61 (5). 2017 Apr 24.