|
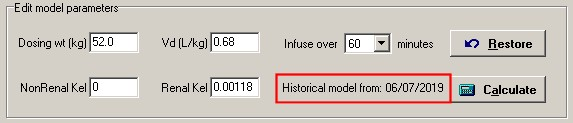
After selecting a drug model you may modify any of the displayed model parameters (+/- 25% of default parameters):
| • | Target peak, peak predict time, and target trough. |
| • | Length of infusion |
| • | Dosing weight and Vd per kg, used to calculate Volume of distribution: |
Vd = DW x Vd L/kg (x CF)
| • | Nonrenal and Renal constants, used to calculate elimination rate or clearance: |
Kel (or CL) = Nonrenal + [Renal x CrCl]
Note: default model parameters are changed with the drug model editor.
Pediatric dosing
Please note that prospective pediatric dosing is weight-based instead of kinetic based, because of the inaccuracy of pediatric creatinine clearance methods.
Extended interval
EI dosing is enabled if:
| 1. | the model supports extended-interval dosing (aminoglycosides), and |
| 2. | the patient is an adult, and |
| 3. | the CrCl is greater than 30 ml/min. |
|
Retrieve previous analysis
|
If there is a previous serum level analysis on record for this patient, the Retrieve button will be enabled.
| • | Click to select the most recent consult, regardless of drug. |
| • | To narrow the search to a specific drug, select a model first then Click. |
| • | The retrieve function will fill in the model parameters with the most recently calculated serum level analysis. The date when that historical model was calculated is also displayed. |
| • | Hover the mouse anywhere over the ‘Edit model parameters’ frame to display more details about the historical model (weight, CrCl, measured trough, Kel, and Vd). |
| • | Click the “Restore” button to switch to the population model. You can use the “Retrieve” and “Restore” buttons to toggle back and forth between population and historical models for comparison. |
|
Ideal dose calculation
|
Click the Calculate button to display the Kel, Vd, and the ideal dosing regimen for the patient and model selected.
You then enter a practical dose and interval. The program will calculate and display an estimated steady-state peak and trough level.
To view the dose in mg/kg, hover the mouse pointer over the dose input box.
Please Note:
After a dose and interval are entered, the Print and View Graph functions are enabled.
If you wish to have a serum level graph printed on your dosing consult, click the View Graph icon ![]() then click Save Graph.
then click Save Graph.